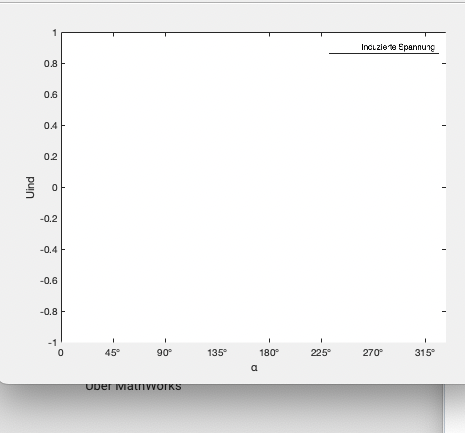
Hey , ich will Animation des Liniendiagramms der induzierten Spannung
mittels Matlab zu zeichnen , aber ich komme nicht weiter


clear all;
clc;

a = 1;
z = 0:pi/4:5/2*pi;
y = a*sin(z);
Nz = length(z);
% Set up your plot environment
figure
h = plot(z(1),y(1));
xlim([0 370])
ylim([-1 1])
xlabel('α')
xticklabels({'0','45°','90°','135°','180°','225°','270°','315°','360°'})
%yticklabels({'-1','0','1'})

ylabel('Uind')
legend('Induzierte Spannung')
init_getframe = struct('cdata',[],'colormap',[]); % The image data
stored as
% an array of uint8 values
frames = repmat(init_getframe, Nz, 1 );
frames(1) = getframe;
% Get frames
for i = 2:Nz
    set(h,'XData',0:45:375);
    set(h,'YData',i:1);
    drawnow
    frames(i) = getframe;
end
% Play movie
movie(frames)
Angehängte Dateien:
Angehängte Dateien:
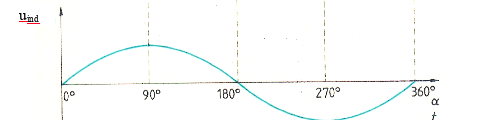
Ergebnis sollte so sein
Bitte melde dich an um einen Beitrag zu schreiben. Anmeldung ist kostenlos und dauert nur eine Minute.
Bestehender Account
Schon ein Account bei Google/GoogleMail? Keine Anmeldung erforderlich!
Mit Google-Account einloggen
Mit Google-Account einloggen
Noch kein Account? Hier anmelden.